How we mapped illegal cannabis farms in California
Nobody knows how widespread illegal cannabis grows are in California. So we mapped them
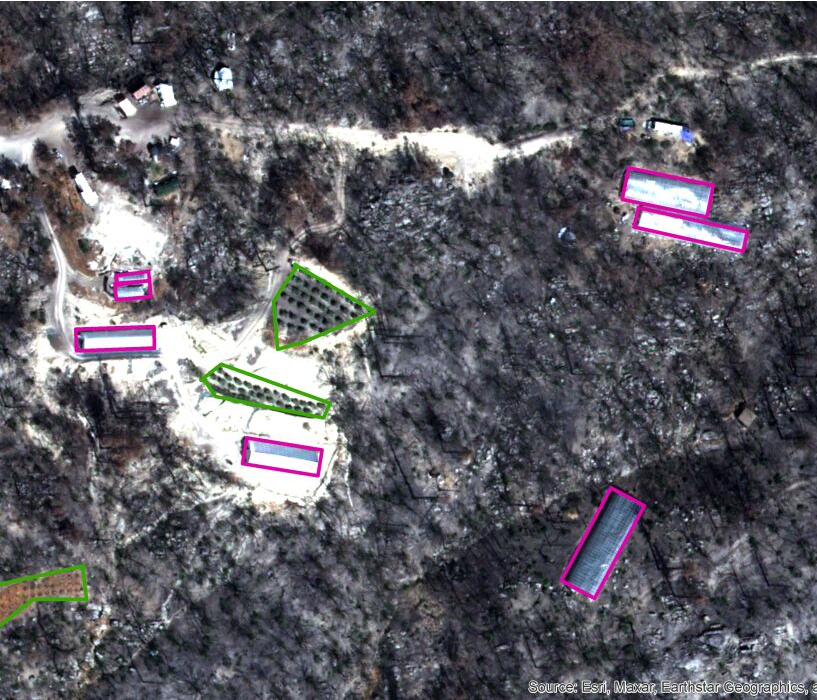
Cannabis greenhouses and gardens rise from the ashes of the North Complex fire in Berry Creek. This September 2021 satellite image shows how greenhouses (magenta) and gardens (green) are identified.
BY PAIGE ST. JOHN STAFF WRITER
SEPT. 8, 2022
By 2013, illegal cannabis grows were such a destructive environmental force in California that state water regulators decided it time to go beyond their complaint-driven, piecemeal approach at enforcement.
That required knowing how much cannabis there was statewide, and where.
Nearly a decade later, the answer still eludes California.
So the Los Angeles Times embarked on its own effort to map illegally grown cannabis, one that depended on a view from space.
Cannabis operations are easy to spot in satellite imagery. Plastic-covered hoop houses and plots of individual dark-green plants are distinctive and hard to miss, even more so in clear-cut tracts of forest or vast expanses of desert.
The Times obtained 2021 satellite imagery from a mix of public and private sources to canvass nearly 3,000 square miles of land in parts of six counties: Siskiyou, Trinity, Mendocino, Shasta, Butte and San Bernardino.
The analysis counted outdoor cultivation spots and measured the square footage of greenhouses. It avoided areas with other active agriculture that could be mistaken for cannabis, and looked for telltale signs of weed, such as outdoor swimming pools to hold water and outdoor plots adjacent to hoop houses.
To estimate greenhouse crops, The Times used industry-supplied yield formulas. Not all greenhouses were filled and some crops were lost to wildfire or police raids, so The Times followed another industry practice and reduced raw crop estimates by 30%.
Measured that way, the survey area contained 25 million square feet of illicit greenhouses with ample capacity to grow 2.6 million pounds of weed — enough to supply the entire legal California market.
The illegality of these grows was determined using licensing maps obtained from the state Department of Cannabis Control, county permit databases, hemp registrations and tax assessor parcel records. On Native American reservations, where unique ordinances sometimes permit commercial cultivation, The Times also used ownership maps obtained from the U.S. Bureau of Indian Affairs.
By comparing these 2021 maps with those created from satellite imagery four to five years earlier by The Times or by state contractors, the analysis documented dramatic shifts in how and where cannabis is grown.
In every place The Times looked, illicit cannabis production had increased since California reduced criminal penalties for unlicensed operations as part of legalization. There was little variation between areas that licensed cannabis and those that banned it. The findings suggest efforts to draw cannabis growers into the legal market are foundering. All but 68 of the 782 cannabis farms below Post Mountain in Trinity County, for instance, lacked a state license as of early 2022.

California’s legalization of recreational cannabis in 2016 ushered in a multibillion-dollar industry estimated to be the largest legal weed market in the world. But many of the promises of legalization have proved elusive. In a series of occasional stories, we’ll explore the fallout of legal pot in California.
Cannabis researchers at UC Berkeley follow a similar methodology to map and measure changes in cannabis cultivation. Humboldt and El Dorado counties also use satellite imagery to find illicit growers and enforce local cannabis codes.
California’s effort to map cannabis began in 2013 after complaints from Butte and other counties that failure to curb illicit operations violated the federal Clean Water Act. The state’s various environmental agencies created marijuana enforcement divisions, and the California Water Resources Control Board in 2015 brought in a private contractor to identify cannabis crops.
The results were outmoded and incomplete. The company reviewed satellite images for only a fraction of California’s geography, steering clear of federal and agricultural lands. Its process was so slow the final maps were two to four years out of date, and the 29,000 “facilities” identified as cannabis grows included not just greenhouses and gardens but also shopping centers.
Deep within the California Water Resources Control Board, a state engineer in 2017 took up the task of building a faster, more comprehensive tool. It was a machine-learning program that could automatically detect cannabis cultivation on high-resolution satellite images.
Agency staff dubbed it CannaVision.
By 2020, CannaVision could find cannabis farms missed by the state contractor, and canvass entire counties overnight. The program generated keen interest across state agencies from staff frustrated by years of hunting for cannabis crops degrading streams and endangering wildlife.
Over the course of eight months, talking point memos and draft news releases were prepared describing CannaVision as able to quickly identify illegal sites, and steer regulators to where environmental damage was greatest.
The software also was credited with the ability to calculate the amount of cannabis grown in California — though state officials say it has yet to be put to that task.
Ready for public launch, the agency in August 2020 gave Gov. Gavin Newsom’s office its first full look at CannaVision, including maps that showed that illicit cultivation outnumbered licensed grows. The governor’s office was represented by Newsom’s senior cannabis advisor, now head of the Department of Cannabis Control, Nicole Elliott.
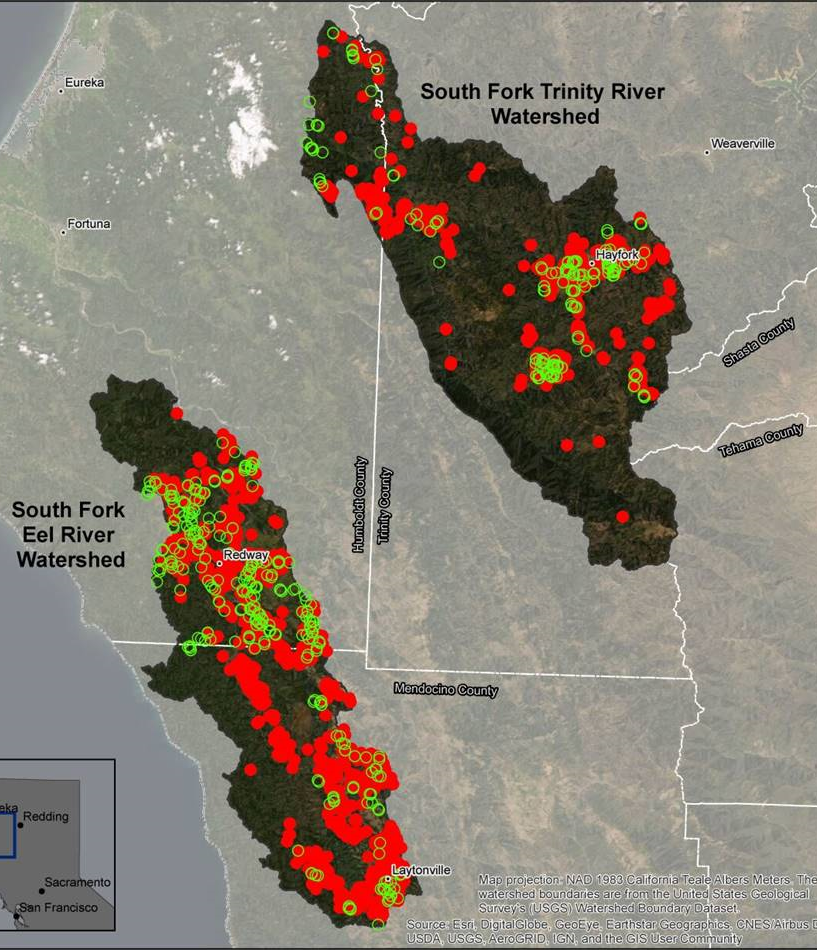
CannaVision’s introduction to the governor’s office included this map showing unlicensed cannabis activity (red) surpassing licensed farms (green) within the Emerald Triangle. (California State Water Resources Control Board)
Days later, the public rollout was killed and its website taken down, according to documents released under the state’s public records law. Even public relations staff who spent months honing the media package were not told why. The deputy water agency director who had led the presentation to Elliott described the situation as “a giant cluster-f—” and told fellow directors he would explain only by private chat.
Elliott didn’t recall making specific comments or objections at the meeting, a spokesperson for the Department of Cannabis Control said, “but to the best of her knowledge there was a discussion related to data quality and use of the resource as an investigative tool.” The water agency said that after the briefing with Elliott, staff “received questions about the accuracy of the data” from unnamed participants and a decision was made that CannaVision “was still in its infancy and a formal rollout would be premature.”
A shroud of secrecy then soon enveloped the program. Water administrators sought legal advice on keeping CannaVision out of the public eye, exempt from public records disclosure.
Internal discussions show they struggled to provide a reason to keep CannaVision confidential. Suggestions ranged from whether a private company could replicate the software for profit to whether CannaVision might make illegal cultivators targets for robbery.
“We need to put on our nefarious hats and think about how someone could use this data to do ill,” CannaVision’s developer wrote. “I think we should try to slow the release of it for a while since we don’t really have the full picture of how a bad actor could use this.”
Privacy concerns were raised again a year later to deny The Times access to CannaVision’s raw maps. The water agency agreed to provide only maps showing the number of greenhouses per square mile.
It took nine months for the state agency to release the documents and emails used to produce this story, while an agency spokesperson sought to blur CannaVision’s singular focus on cannabis, suggesting it could also be used to identify avocado plantations.
But internally, CannaVision was embraced as a tool against illegal cultivation.
Agency records and interviews show the computer program’s data runs are now shared with agencies willing to sign confidentiality agreements, including the Department of Fish and Wildlife, which raids illegal farms. Most recently, it was used to identify cannabis cultivation on a Humboldt County watershed where low water conditions imperil native salmon. Weeks later, state cannabis officers began a series of surprise farm inspections in the area.
At a December agency presentation, the governor’s environmental protection secretary, Jared Blumenfeld, applauded CannaVision as a tool to target and deter illicit cultivators, who, he said, “would be like, ‘Jesus, these guys have an eye in the sky, we need to think twice.’”
From: Sosncore <sosncore-bounces@sosneighborhoods.com> On Behalf Of Sanjay Bagai via Sosncore
Sent: Thursday, September 8, 2022 11:39 AM
To: Sosncore <sosncore@sosneighborhoods.com>
Subject: [Sosncore] Los Angeles Times: How we mapped illegal cannabis farms in California
Los Angeles Times: How we mapped illegal cannabis farms in California.
https://www.latimes.com/california/story/2022-09-08/how-we-mapped-illegal-cannabis-farms-in-california?consumer=googlenews
Recent Comments